Introduction
A sudden ammonia “spike” at a monitoring site in Suffolk appeared to signal a serious pollution incident. However, once all the evidence was analysed, the story changed completely.
A Seneye sensor was deployed alongside a Xylem EXO sonde as part of monitoring work for Anglian Water. While the EXO reported ammonia levels nearly ten times higher than reality, the Seneye sensors revealed the true cause: pH drift had produced a false alarm.
Further insight came from eDNA analysis. A triggered sample taken during the event showed no human markers, no human waste, and no organic pollution source at all.
This was not a sewage incident. No outfall was responsible. No enforcement action should have been triggered.
Want to see what really caused the event — and how direct NH₃ monitoring combined with eDNA prevented costly misattribution? Read on.
Part 1: Why Accurate Water Quality Monitoring Matters
At its most fundamental level, water quality monitoring exists to protect life. Rivers, lakes and coastal waters must support fish, invertebrates, plants and entire ecosystems. To achieve this, we must measure the parameters that directly affect aquatic health.
The Environment Act 2021 created a new legal framework for environmental protection in the UK following Brexit, with goals including improved water quality, wildlife protection and stronger environmental governance.
Under Section 82 of the Act, operators of licensed discharges into watercourses must monitor specific parameters to safeguard ecological health.
Key parameters include:
- pH – Even small shifts can cause stress or mortality in aquatic organisms.
- Dissolved oxygen – Without oxygen, fish and invertebrates cannot survive.
- Temperature – Affects metabolism and oxygen solubility.
- Turbidity – Indicates sediment disturbance, runoff or pollution events.
Why Ammonia Is Critical
Ammonia is directly toxic. Even at low concentrations, toxic ammonia (NH₃) can seriously harm or kill aquatic life. Sensitivity varies by species and life stage, but one rule holds true:
Safe levels of NH₃ are as close to zero as possible.

Ammonia is both:
- A direct cause of ecological damage, and
- A powerful indicator of pollution events.
Because ammonia data is often used as legal evidence, how it is measured matters enormously.
Monitoring at East Gate Bridge, River Lark
At East Gate Bridge on the River Lark in Suffolk, both a Seneye sensor and a Xylem EXO sonde were deployed to monitor water quality during a period of persistently low dissolved oxygen.
The EXO was installed directly beneath an aerator mandated by the Environment Agency. Two Seneye sensors were placed independently: one 20 m upstream and one 140 m downstream.
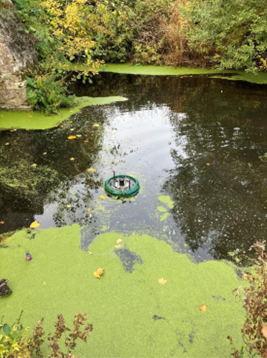
A thick layer of algae was visible on the water surface — typical of low oxygen, slow-flowing conditions.
The results were clear:
- The aerator created only a tiny pocket of oxygen improvement beneath the EXO sonde.
- Neither Seneye sensor upstream or downstream recorded meaningful improvement.
- The aerator’s benefit was extremely localised and not helping the wider river.
But the most important insight came from ammonia data.
Direct Measurement vs Calculated Ammonia
The Seneye sensor measures toxic ammonia (NH₃) directly using optical chemistry.
The EXO sonde does not measure NH₃ directly. Instead, it calculates ammonia from:
- Ammonium
- pH
- Temperature
This indirect approach is highly vulnerable to pH drift. Because NH₃ concentrations are very small, tiny pH errors can multiply calculated ammonia values dramatically.
That vulnerability became obvious at East Gate Bridge.
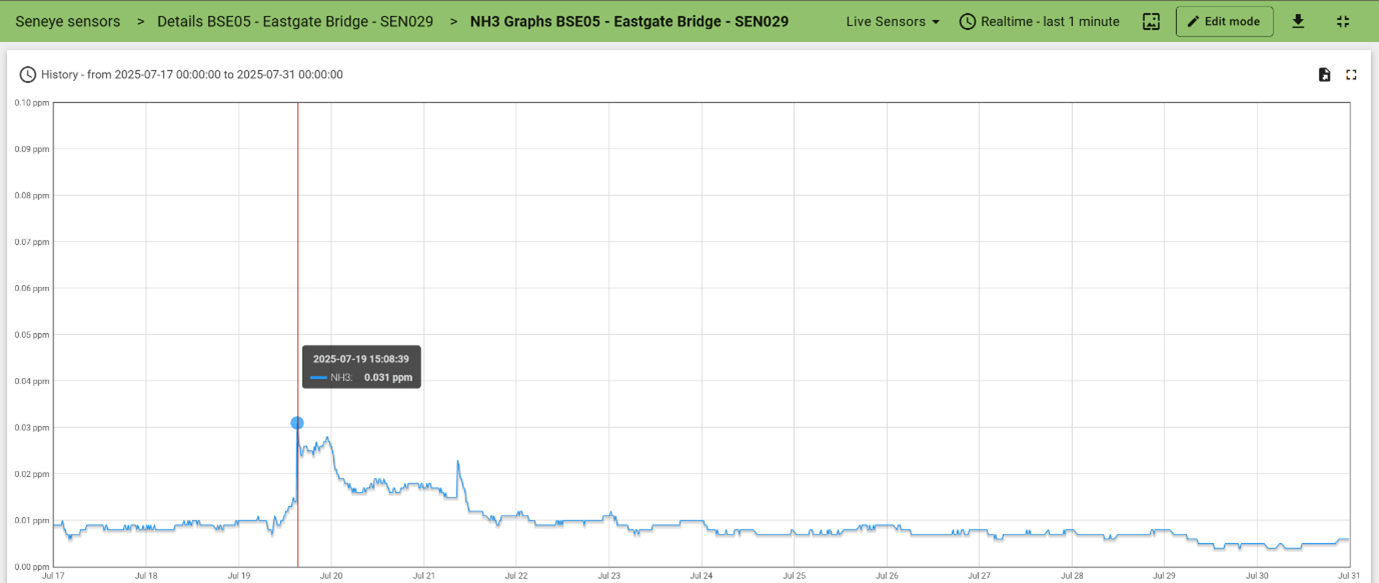
 readings from the two sensors.png)
The EXO reported an ammonia spike nearly ten times higher than the Seneye measurement.
Why the Spike Was False
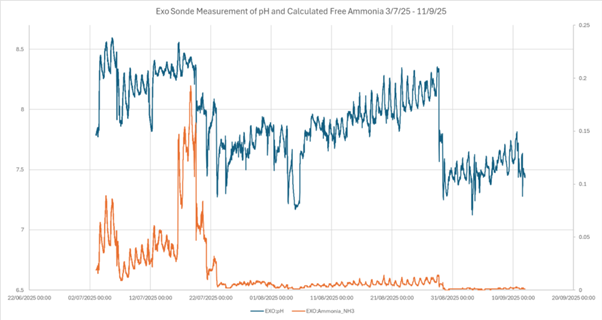
Each sudden jump in EXO “free ammonia” aligned with an equally sudden jump in pH — almost certainly due to probe drift or recalibration.
Retrospectively correcting the EXO pH data reduced the spike, but this approach has serious flaws:
- It cannot provide accurate ammonia measurement.
- Drift can only be identified months later.
- It cannot distinguish sensor drift from real river chemistry changes.
- It assumes ammonium readings are accurate.
- Errors compound across multiple calculated parameters.
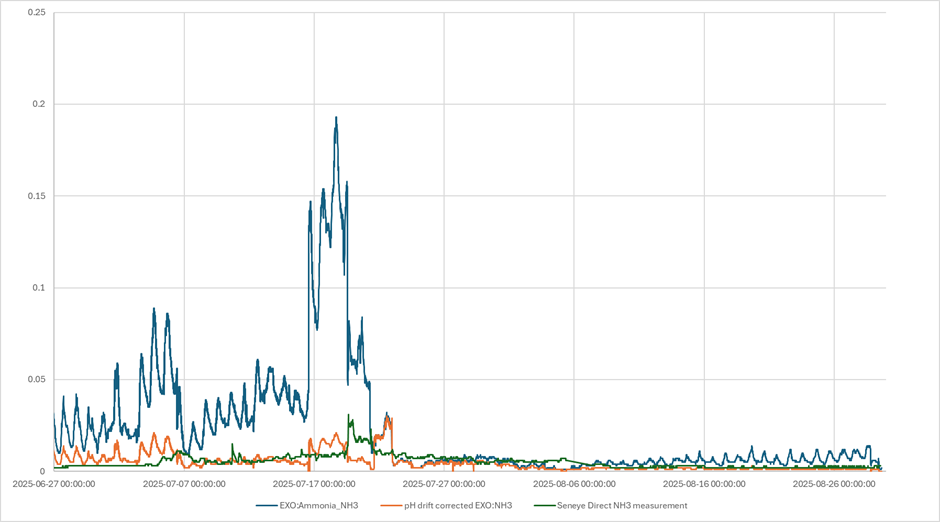
- Blue line: EXO original calculated ammonia (false peak near 0.2 ppm NH₃).
- Orange line: EXO recalculated after pH correction (still approximate).
- Green line: Seneye direct NH₃ measurement (true value).
Part 2: What the eDNA Revealed
When a pollution event is detected, microsamplers attached to the Seneye sensor collect and preserve water samples for later analysis.
The results were striking.
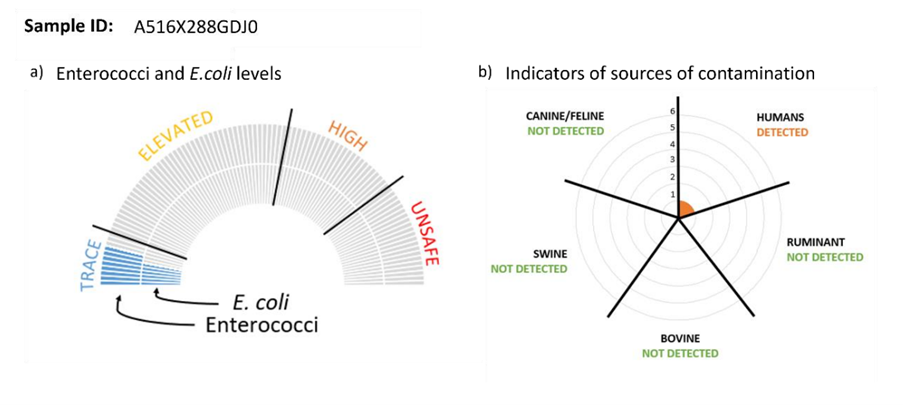
There was:
- No meaningful organic matter
- Only trace E. coli and enterococci
- Only one weak human marker
This profile is entirely normal for a river and showed no evidence of sewage, livestock waste or organic pollution.
Yet Seneye still recorded a real ammonia spike.
So where did it come from?
Identifying the True Source
Using aerial imagery and local field knowledge, attention focused on nearby automotive service businesses located metres from the monitoring site.
A working hypothesis emerged: a non-organic chemical discharge such as AdBlue or industrial cleaning agents had entered surface drainage.
AdBlue is urea-based and rapidly converts to ammonia in water, fitting the observed chemistry.
To test this, the micro-sampler’s second channel — packed with API-specific Starbon material — was analysed for industrial chemical residues.
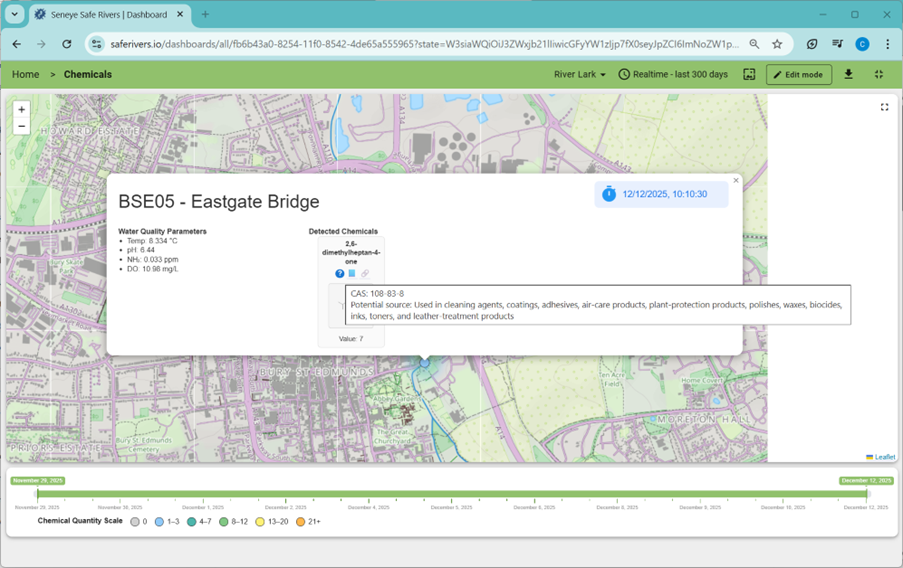
The API analysis showed signals consistent with cleaning agents, confirming a chemical, not organic, source.
Integrated Evidence
Together, the evidence formed a coherent picture:
- eDNA → no organic pollution
- Direct NH₃ monitoring → real ammonia spike
- API analysis → industrial chemical residues
This showed clearly that:
- The spike was not sewage-related
- No outfall was responsible
- No enforcement action against the water company was justified
The integrated approach prevented unnecessary investigations and avoided false blame.
Conclusion
The East Gate Bridge case demonstrates how easily water quality readings can escalate into false pollution accusations.
A drifting pH probe inflated calculated ammonia by more than tenfold — enough to trigger enforcement, public concern and reputational damage.
By combining:
- Direct NH₃ monitoring
- eDNA source tracking
- API chemical analysis
the investigation revealed the true cause: a non-organic chemical discharge, most likely from nearby automotive businesses.
Integrated monitoring did more than detect pollution — it revealed the truth behind it.