Routine seasonal sampling in the River Lark catchment revealed a significant swine‑derived pollution event. Using continuous water‑quality monitoring, automated microsamplers, and environmental DNA (eDNA) microbial source tracking (MST), investigators pinpointed when the pollution occurred, where it originated, and who was responsible. This blended approach provided both the timing and the biological proof needed to resolve a complex multi‑source catchment.
Fourteen sites. Multiple potential pollution sources. The key question: when does pollution occur and how do you prove it?
Project Overview
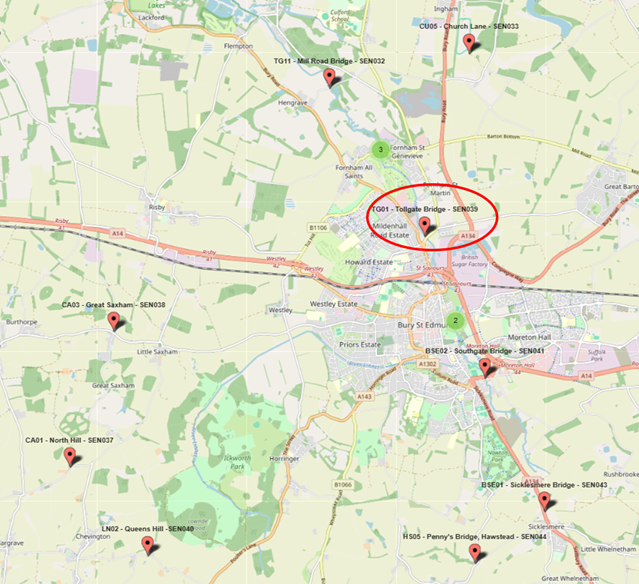
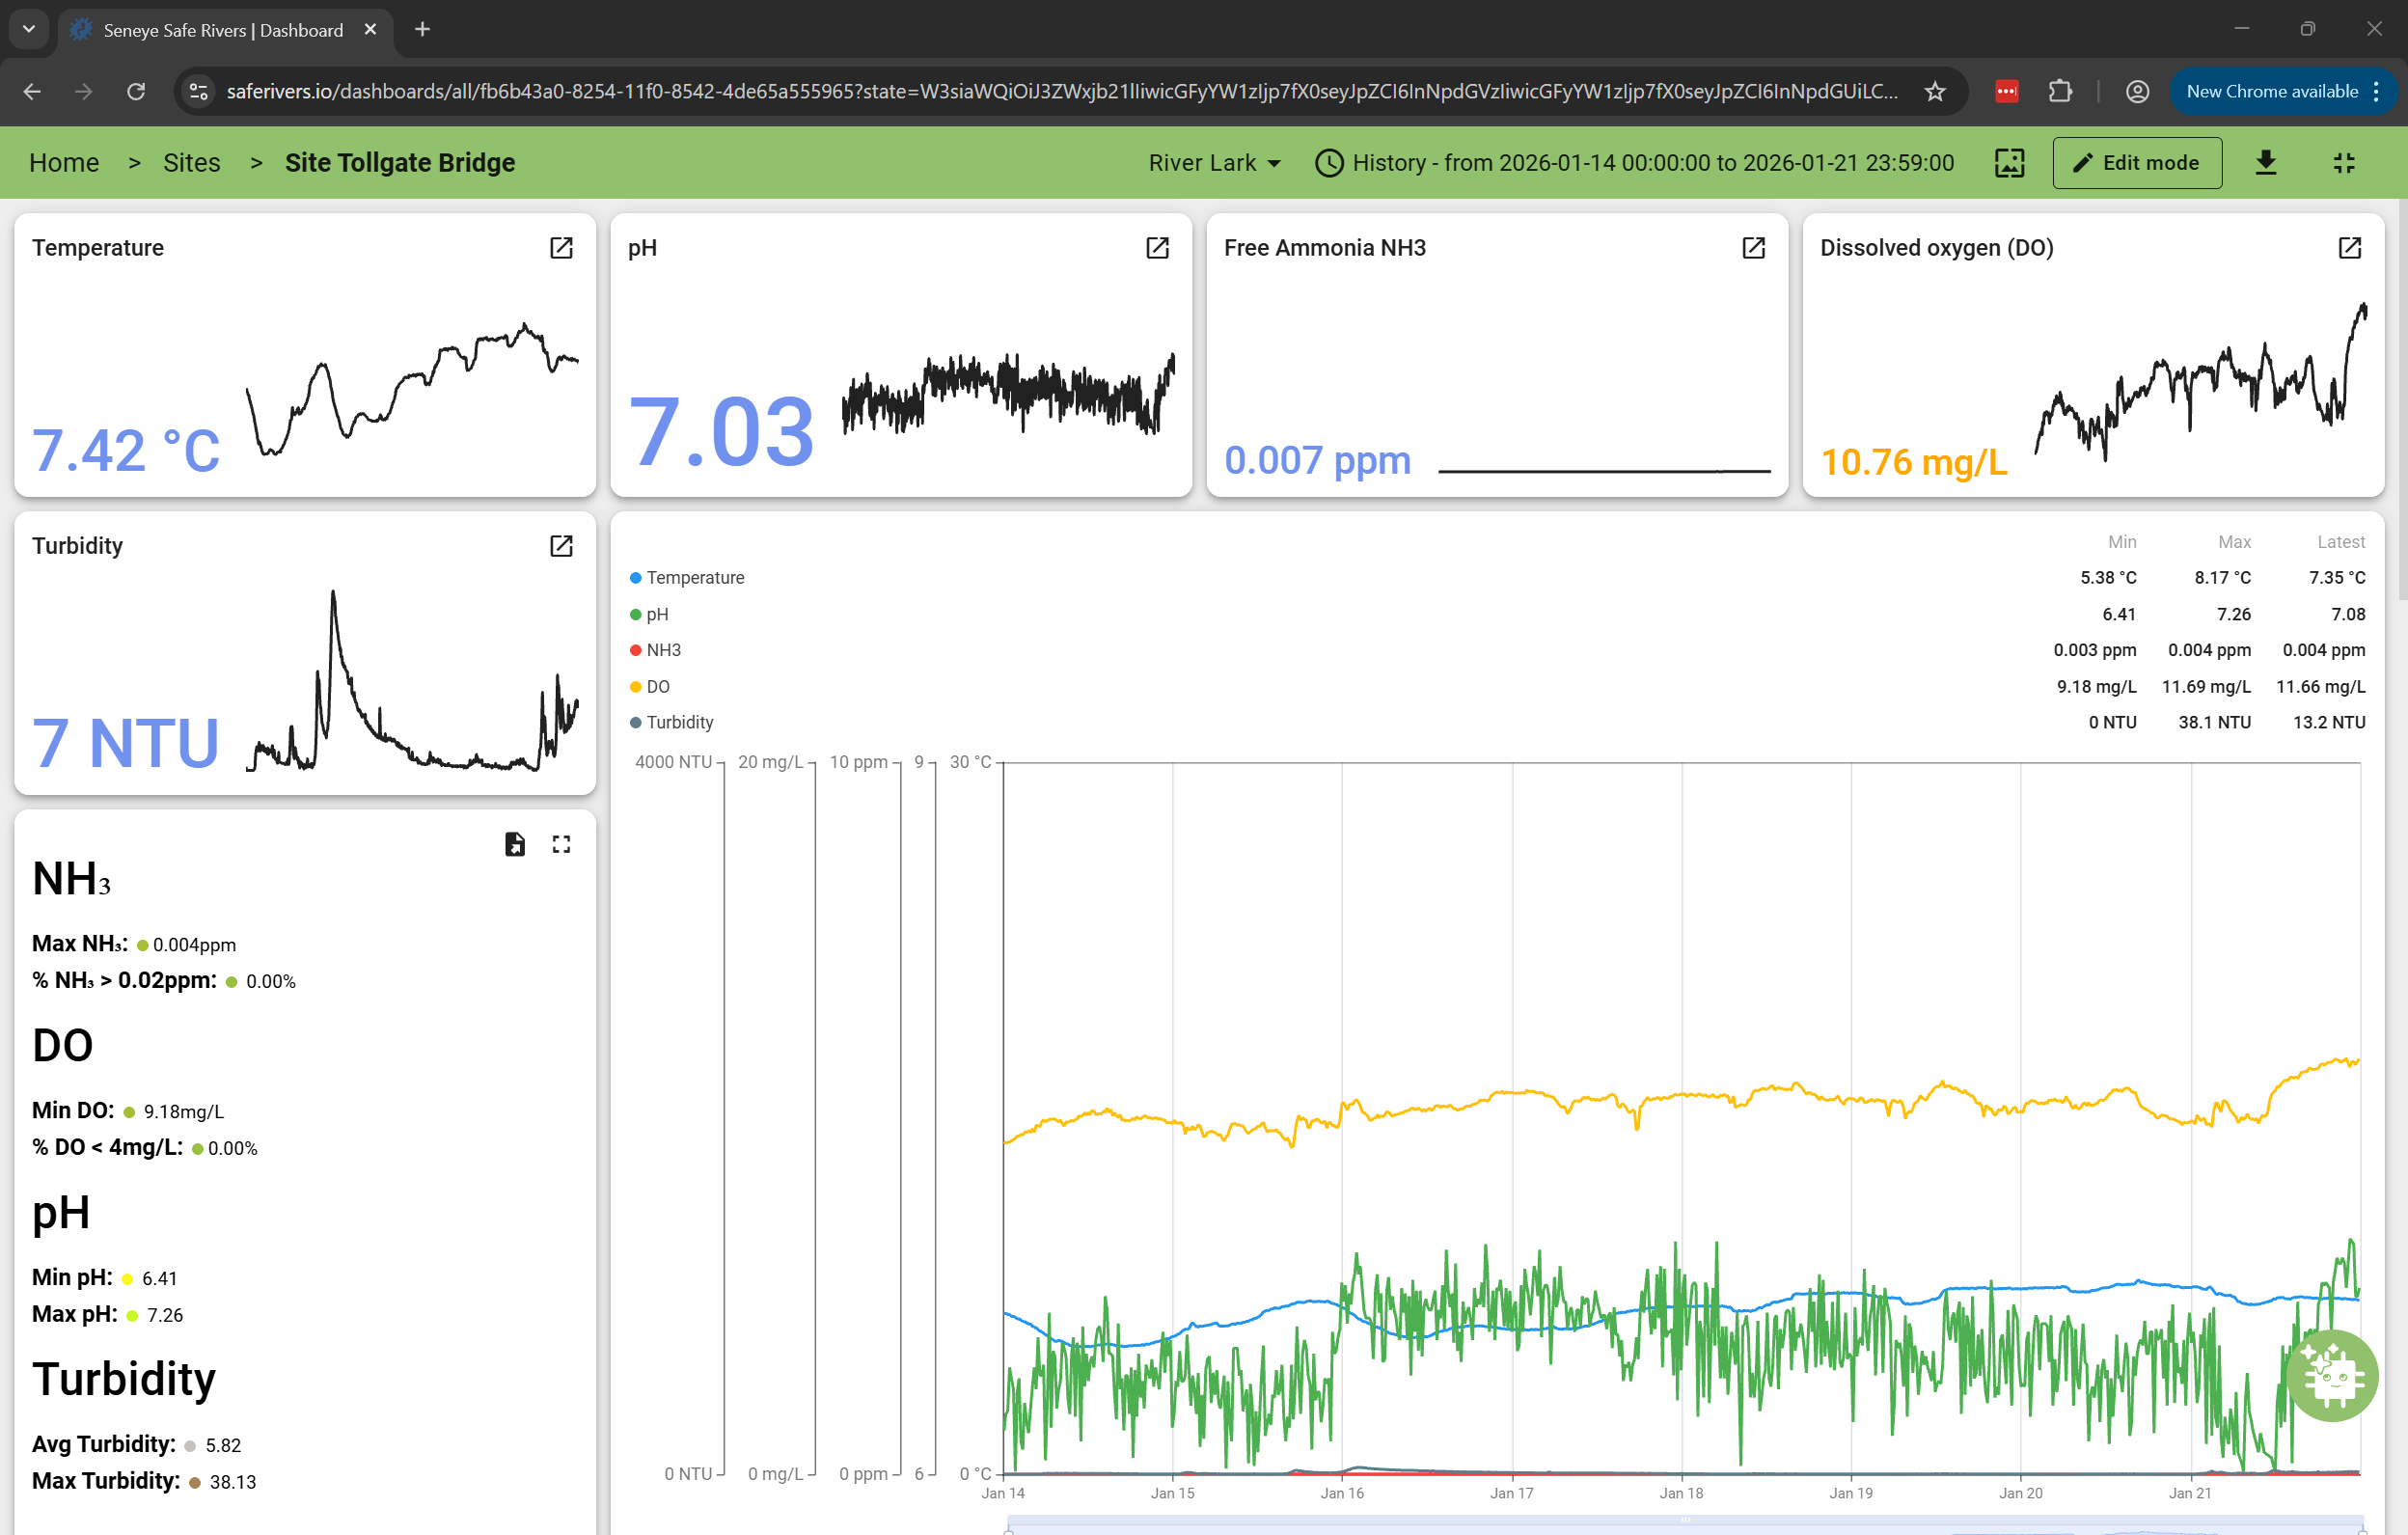
The River Lark project deployed fourteen monitoring sites along a 60 km stretch of the Suffolk catchment. Each site captured data every 15 minutes for:
- Temperature
- pH
- Dissolved oxygen (DO)
- Turbidity
- Toxic ammonia (NH₃)
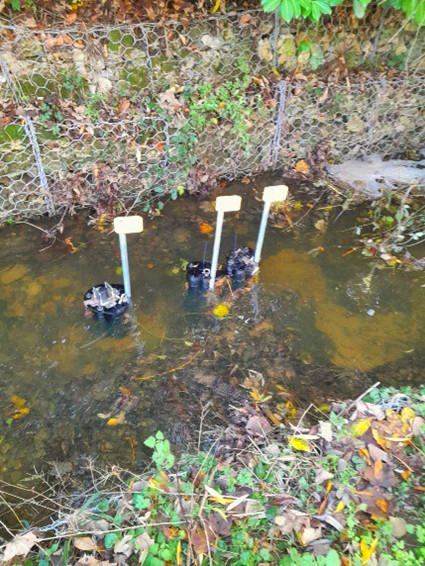
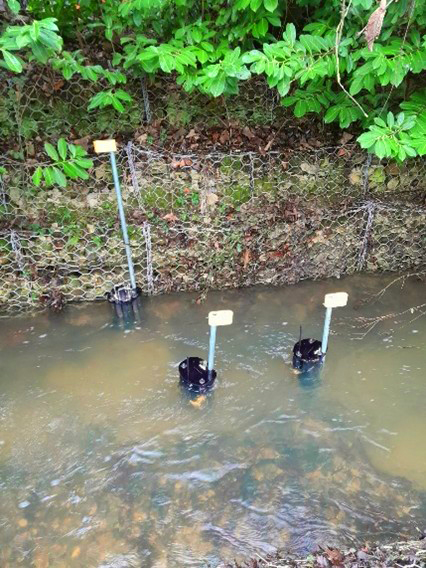
Two automated microsamplers were installed at each site. Triggered by ammonia spikes, they collected water samples at the exact moment a pollution event occurred. Samples were preserved and later analysed for eDNA, enabling microbial source tracking (MST) to determine the biological origin of contamination.
This blended approach provided both timing and proof, identifying not only when pollution happened, but where it came from.
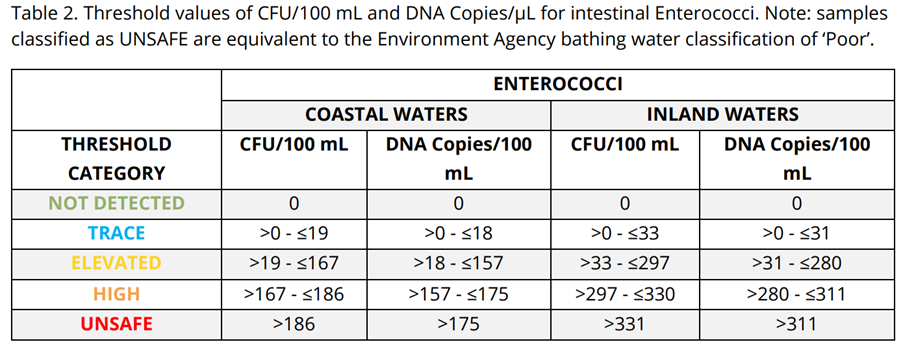
Baseline sampling showed:
- Trace human DNA across the catchment
- Ruminant markers at several sites
- No significant swine or bovine DNA
Then the seasons changed — and so did the data.
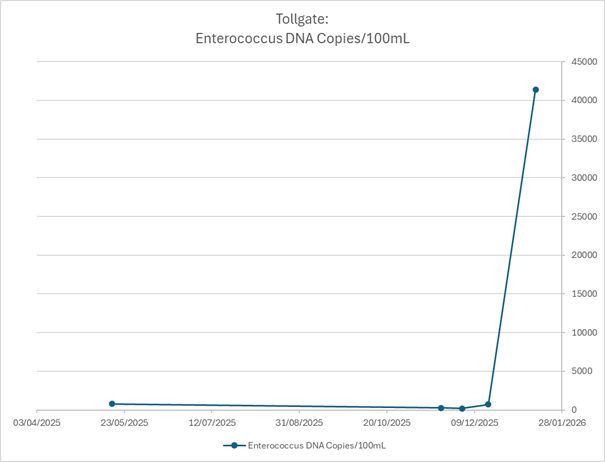
A Sudden Spike at Tollgate Bridge
At Tollgate Bridge, a control site upstream of a sewage treatment plant, enterococci levels suddenly surged to approximately 41,000 copies per 100 mL — four times higher than any previous reading.
Historically, this location showed elevated or unsafe readings (<1,000 copies per 100 mL), but nothing of this magnitude.
This result demanded immediate investigation. Without MST, the spike would remain unexplained and open to dispute. Elevated indicator bacteria alone cannot distinguish between:
- Agricultural runoff
- Failing septic systems
- Wildlife
- Wastewater infrastructure
In mixed‑use catchments, this uncertainty stalls action. microbial source tracking (MST) changes that. eDNA analysis revealed the contamination was swine‑derived.
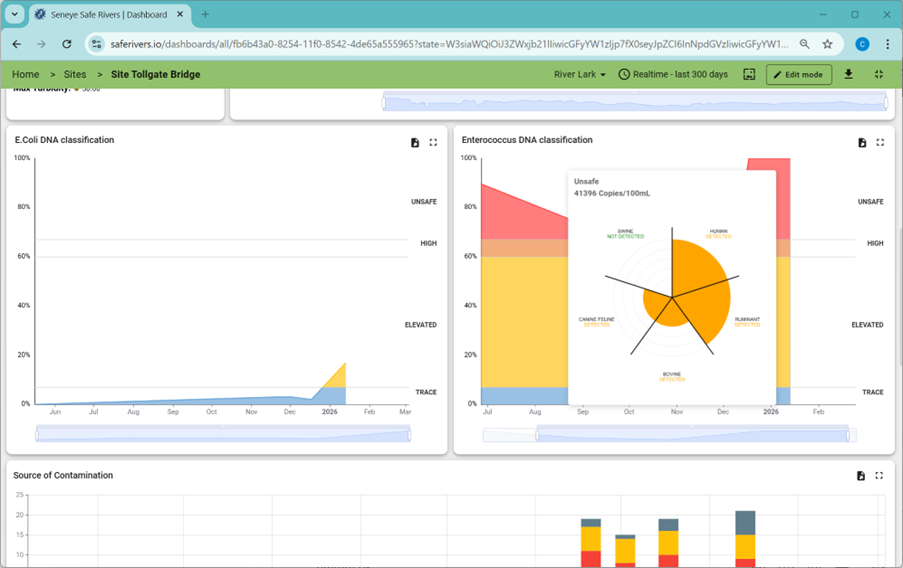
Sensor data also showed:
- Repeated turbidity spikes
- A drop in dissolved oxygen
- A decrease in pH
Tracing the Source Upstream
With 13 additional monitoring points, the team traced the signal upstream. At Southgate, upstream of Tollgate:
- Swine markers detected
- Enterococci: 1,386 copies per 100 mL
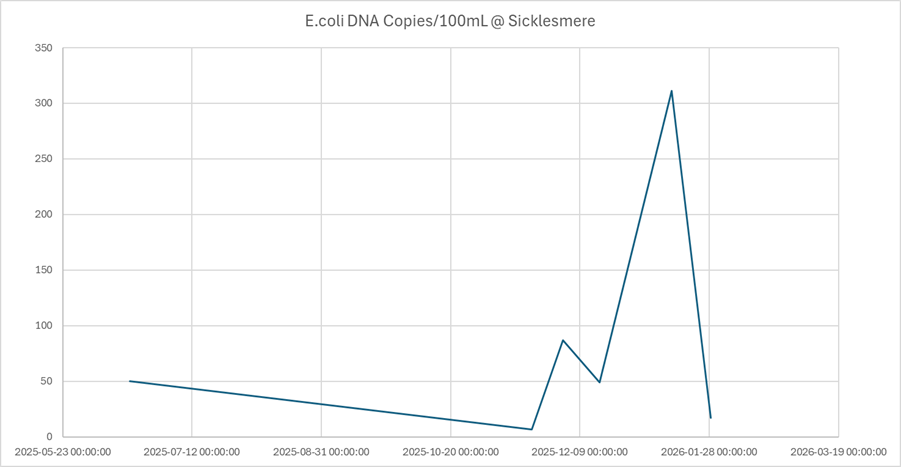
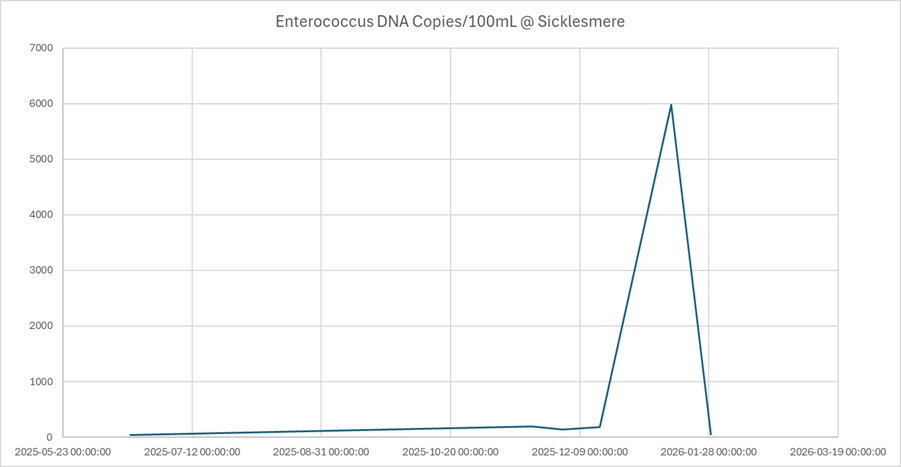
The next upstream site with pollution was Sicklesmere.
At Sicklesmere (400 m downstream of a CSO), historical data typically showed:
- Elevated enterococci and E. coli linked to human sources
- Occasional ruminant markers
- Generally acceptable physicochemical water quality
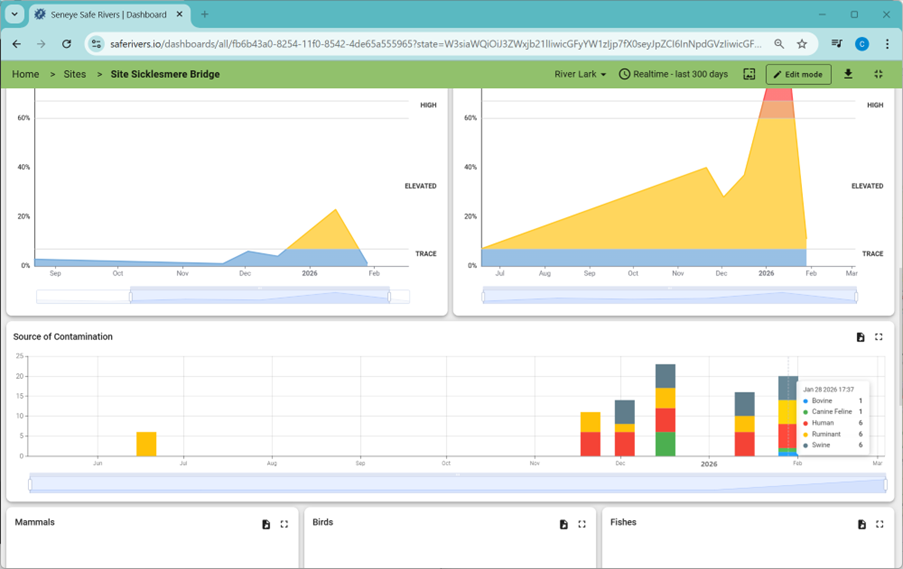
As winter progressed, the eDNA profile shifted dramatically.
- Early December: swine markers appeared (low copy numbers)
- January: swine DNA surged to 15,175 copies per 100 mL
- E. coli: 311 copies per 100 mL
- Enterococci: 5,985 copies per 100 mL
Downstream at Penny’s Bridge, no swine markers were detected.
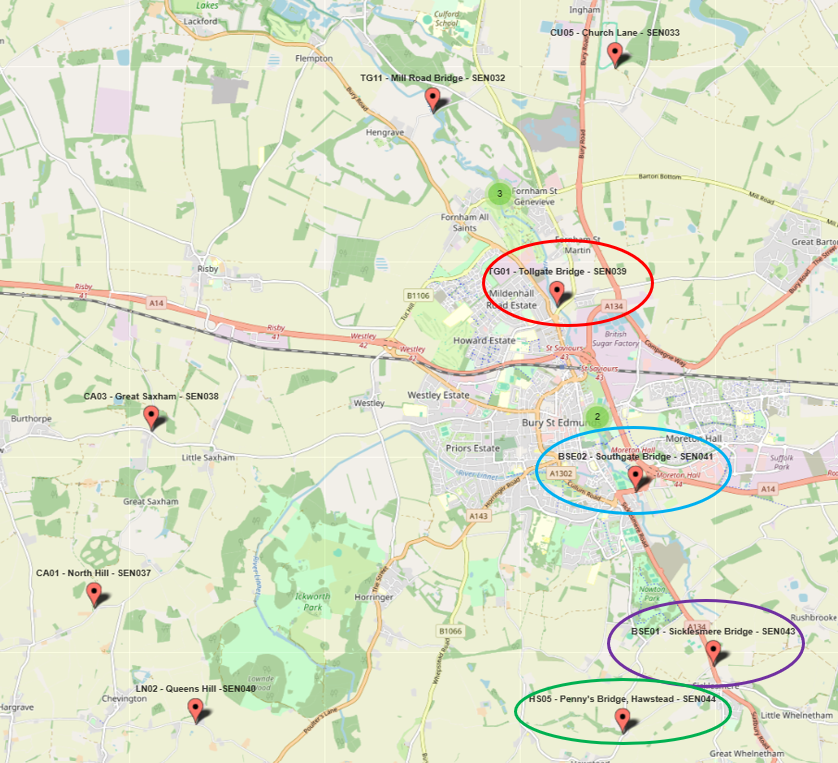
By comparing samples taken within hours of each other, the team narrowed the pollution source from a 15 km search area to less than 2 km.
Actionable Intelligence for the Catchment Partnership
The River Lark Catchment Partnership investigated potential pig farming operations within the narrowed corridor.
A volunteer and former agricultural chemist identified a likely source:
- An outdoor pig unit visible on satellite imagery
- Pigs had recently been relocated closer to the river
- The land sloped directly toward the watercourse
- A clear runoff pathway existed
Without continuous monitoring, MST, and distributed sensors, this event would likely have gone undetected or misattributed.
Instead, the system provided:
- Early warning of contamination
- Species‑level source attribution
- Rapid spatial narrowing
- Evidence‑based insight for targeted investigation
- Identification of a high‑risk agricultural runoff pathway
The Bigger Picture
Routine seasonal sampling didn’t just collect data — it revealed a hidden pollution event and translated it into action.
By combining:
- Real‑time sensing
- Automated microsamplers
- eDNA‑based microbial source tracking
- Catchment‑scale sensor networks
the project transformed reactive water‑quality testing into proactive catchment intelligence.
From baseline stability to pinpointing a swine pollution event within a 2 km stretch — and tracing it to a specific land‑use change — the River Lark project demonstrates the power of continuous, high‑resolution environmental monitoring to protect river health, support targeted enforcement, and safeguard public safety.